
pNode Diagnostic Tool: Auto Health Checker
Hello pNode Operators 
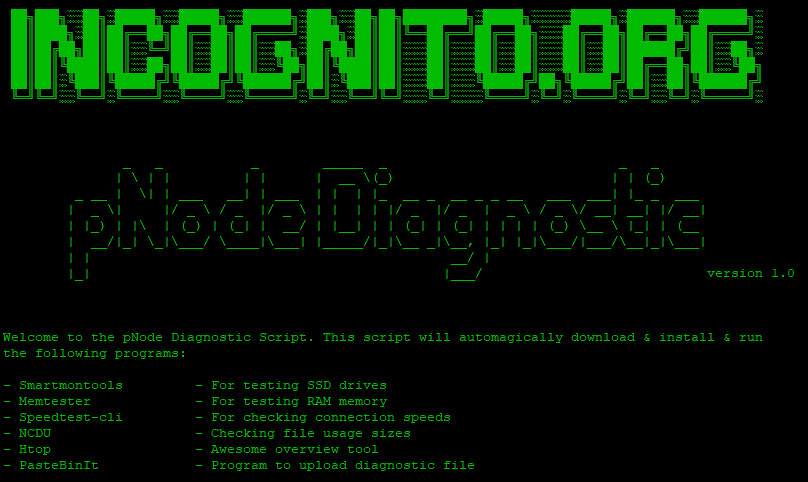
We’re excited to unveil a new tool tailored to be your go-to solution when your pNode seems to be acting up: the pNode Diagnostic Tool.
Changelog:
Version 1.0 - 08/14/2023 -
- Initial Release of pNode Diagnostic Tool.
- Features:
- SSD health checks with Smartmontools
- RAM analysis using Memtester
- Connection speed tests via Speedtest-cli
- Diagnostic file sharing
- Enhanced user experience with color-coded outputs.
- Optimized for faster diagnostics.
What’s the pNode Diagnostic Tool?
Think of this tool as a health check-up for your pNode. Just as we sometimes need a routine check-up, our pNodes can benefit from one too. This tool delves deep into the system to ensure everything is running as it should.
Here’s what the pNode Diagnostic Tool can assist with:
- SSD Health : Using Smartmontools, it checks the health and performance of your SSD drives.
- RAM Check : With Memtester, it ensures your RAM memory is functioning optimally.
- Connection Analysis : Speedtest-cli measures your connection speeds, ensuring your pNode stays connected.
- File Usage : NCDU provides insights into file usage sizes, ensuring no unnecessary clutter.
- System Overview : Htop gives a comprehensive overview of system processes.
- Diagnostic File Sharing : With PasteBinIt, you can easily share diagnostic files if needed.
When Should You Use It?
While the pNode is designed to be robust, there are times when unforeseen issues can arise. If you’ve noticed:
- Beacon/shard stalling (not fixed by bootstrapping)
- Frequent unexpected restarts
- Connection losses or inconsistencies
…then the pNode Diagnostic Tool is here to help. It’s designed to be your first step in troubleshooting, providing insights that can help pinpoint the root cause of the issue.
Is it Mandatory?
No, this tool is entirely optional. It’s here as a resource for those times when you feel something’s amiss with your pNode. It’s like having a diagnostic expert by your side, ready to help whenever needed.
Getting Started
To run the script, copy and paste the following commands into your pNode via SSH.
Various parts of this script can take a while to run, please be patient and allow the script to run completely.
1. Download :
wget https://raw.githubusercontent.com/lukemax47/pNode-Diagnostic-Tool/main/pnode_diagnostic.sh
2. Set Permissions :
sudo chmod +x pnode_diagnostic.sh
3. Run the Tool :
sudo ./pnode_diagnostic.sh
4. Share Results :
After the diagnostic completes, you’ll get a link. Share it at we.incognito.org/g/Support for the pNode support team to review.
Wrapping Up
We understand the importance of having a smoothly operating pNode. It’s crucial not just for you, but for the entire Incognito network. The pNode Diagnostic Tool is our way of ensuring you have all the resources at your disposal to diagnose and address potential issues.
If you ever find yourself scratching your head, wondering why your pNode is behaving unusually, remember this tool is here to guide you. Together, we can ensure the health and efficiency of our pNodes and the strength of the Incognito network.
Stay informed, stay proactive, and as always, keep your transactions private. 


