Official pNode Troubleshooting Guide

If you have not already done so, please update to the latest pNode firmware v2.0.0. The screenshots in this guide reference this new dashboard.


It’s finally here! The official pNode troubleshooting guide. No longer do you have to search around the forum for answers to your questions.


Use the Node Monitor to check for issues (monitor.incognito.org).
When you see an issue come here to fix it.

Step 1 - Access pNode Dashboard

In order to work through these troubleshooting steps, you will need your pNodes Keychain ID and your pNodes IP address. Both of which can be found on the app as referenced in figure 1.

Figure 1 - pNode Keychain ID & IP Address

If your app does not show an IP address for your pNode please reference your router’s config or use the FING app (www.fing.com).

Once you have these go to your pNodes dashboard.

pNode_IP_Address:5000

Example: 192.168.0.216:5000

Your dashboard should look like figure 2 - pNode Dashboard.


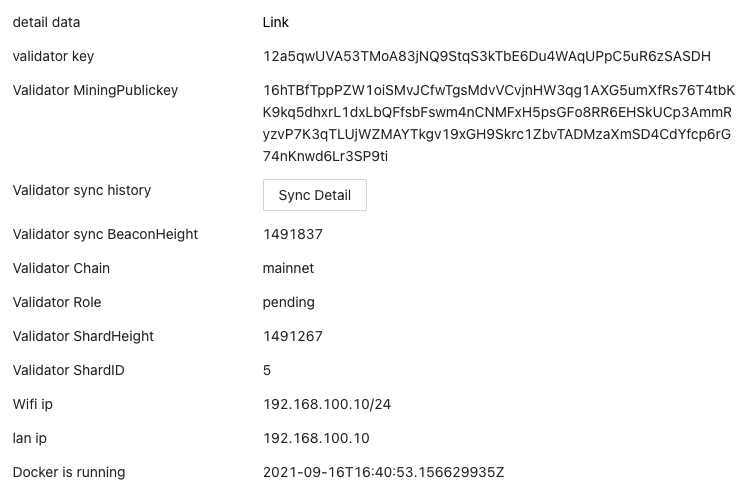
Figure 2 - pNode Dashboard


Step 1 - Restart Docker

Sometimes the Docker container may get stuck. Restarting docker is a simple as a few button clicks. Click on the Terminal button at the top of the dashboard. Now input your QR code in the text field to the left. Lastly, click the Restart Docker button. (reference figure 3 - Restart Docker).

Restart Docker
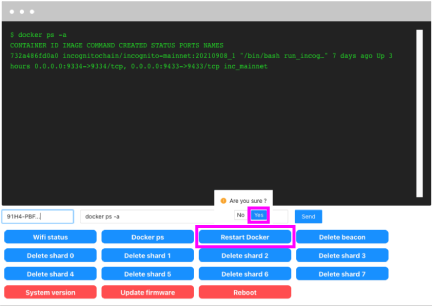
Figure 3 - Restart Docker


Step 2 - Restart pNode

If restarting Docker does not fix your issues please perform a pNode restart/reboot (see figure 4 - pNode Reboot). Click the button labeled Reboot. Please note this process will make the dashboard unresponsive as your pNode turns off and then back on again. Do not unplug or disturb your device while it is rebooting.

pNode Reboot Option
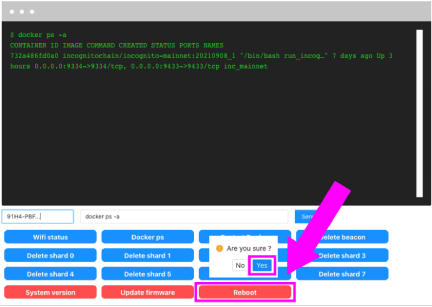
Figure 4 - pNode Reboot


Step 3 - Pull Logs & Send to Support

If in the event none of the above steps fix your pNode you will need to pull the logs and send them to support. Please follow the following steps in order to do this.

  1. Click the Browser button at the top of the dashboard.
  2. Navigate to the most recent log files ().
  3. Click the Download button to save them to your computer.
  4. Upload to Google, Dropbox, or another cloud provider.
  5. Send a message to @support with a link to said file. Please also include what issue(s) you were experiencing.


Figure 5 - pNode Browse Menu

Logs are located in the following directory:
/home/nuc/aos/inco-data/

Continue to step 4...


Step 4 - Delete Stalled Data

After working through the above steps without luck it is time to delete stalled data from your pNode.

Reference the Node Monitor (monitor.incognito.org) and make a mental note of which shard is stalling.

From the Terminal menu on the pNode dashboard click the Delete shard # button that corresponds to the shard your pNode is stalling on (reference figure 6 - Delete Shard Buttons). Confirm this selection by clicking Yes. After about 30 - 60 seconds the pNode will have removed the stalled data. Now for safe measure, click the Restart Docker button. Once again, confirm with Yes.

If your beacon is stalling do the same as deleting a shard with the Delete beacon button.

Delete Shard Buttons
Figure 6 - Delete Shard Buttons

The process to resync data after it has been deleted is time-consuming, even with super-fast internet. After about 5 minutes check the Node Monitor again and your pNode should indicate it is redownloading and resyncing the data that was deleted.


Additional Step - Update Operating System

Updating the Operating System (in this case Ubuntu) is recommend to ensure pNodes have the latest code and security patches. Recommended once a month.

Click the Update Firmware button. Confirm with Yes. The system will begin pulling updates. Note: Do NOT unplug / power down / disturb your pNode during this process. The operating system is pulling a lot of code and making upgrades. This process can take a while the first time (depending on internet speed; 15+ minutes).

Update pNode Operating System
Figure - Update pNode Operating System

That's it. You should now have a fully functioning and healthy pNode!


Bonus Step

Bootstrap your node to quickly get to Sync State Latest:


As always, if anyone has any questions or comments please feel free to drop them below or contact the support account.

13 Likes

Pardon, @Jared. Are you sure, that there is no mistake with Step 1 and 2 links??? IMHO those links should be exchanged with each other.

1 Like

Guide updated. Thank you.

image Hi,
I tried putting in my IP address for my node - however it does not show?? It’s been showing offline past 2 months although I’ve earned from it a few times …How do I get IP details & which browser do I use to put in steps 1) & 2) ??

Hello @ForestCity,

You can either check your router config or use a network scanning app. I personally use Fing, they have a desktop and mobile app (fing.com).

Any browser will work as long as you are on the same network as the pNode.

@Support I tried the commands to troubleshoot a beacon stall issue, however regardless of what command I issue I get an invalid request status.

I did double-check the IP address and the qrcode and they are correct
Even the restart command fails, what am I doing wrong?

http://192.X.X.X:5000/restart-device?qrcode=(QR code without quotation marks)

{"data":{"data":{"action":"restart-device","chain":"incognito","product_id":""},"protocal":"firebase","source":"_PHONE","type":"incognito"},"message":"Invalid request","status":0}

Thanks

Hello @mpilot,

Have you updated to pNode firmware v1.0.9? This latest release allows a 'Click ‘n Go’ approach to fixing issues with pNodes.

If you are unable to get your pNode to upgrade please try power cycling your node.

It’s upgraded to 1.0.9 according to the GUI I didn’t powercycle it so I’ll try it out.

After power cycling it, the version is gone from the gui, commands provide the same response.

did the upgrade failed?

Please schedule a time slot for a remote session:

https://calendly.com/pnode-incognito-support/experiment6

1 Like

A couple of days after the firmware update, the phone app, Power>pNode details screen will sometimes show the Version number 1.0.9 and at other times not show the version number. The node seems to be stable so I assume this might be a minor bug in the phone app where Version number does not consistently display even after refresh. Not a big deal, but thought you should know.

1 Like

I accepted the invite but there is no URL to meet, how are we doing this?

Where are the freakin’ log files?! The only one visible from :5000/browser page is /home/nuc/backup.log

I am not in charge of that meeting setup. I would imagine you will be contacted. I have sent your question to the dev responsible for pNode issues.

Did you try using the Back button at the top to go into other directories?

Do you see new pnode web ui?
Only home page can refresh. Go to it from home page

Yes, but could not find log files anywhere. For future reference, what directory path are they located in?

I ended up going nuclear and deleting all data from the device because I couldn’t afford to take the chance of having my pNode unstaked.

LOL nuclear my miner is slash but the team is working on it for me.

@Jared and @binh - one of my pNodes is also experiencing a similar issue as some other members have explained. The version shows the latest code (1.0.9), and I’ve power cycled the node. I’ve also restarted docker, restarted the node (without deleting data), and then ultimately by deleting data as well - which kicks off the sync process again. But then it comes in and halts at either beacon stall or shard stall. This happened twice in the last 4 days. The step 3 (browser) doesn’t seem to work and I keep getting connection failed/refused. All other steps works as expected. My pnode ultimately got slashed and I haven’t restaked it yet as I’d like to get the sync issues sorted it before pushing it back up there.

Since the browser step doesn’t work, I am unable to get to the UI to grab the logs. Could one of the members of the support team or dev team please let me know how to proceed?

Hello @sid,

It sounds like your pNode failed to update to v1.0.9 if you’re unable to access the dashboard. Have you tried the advance instructions on the v.1.0.9 guide?